
Growth and crisis
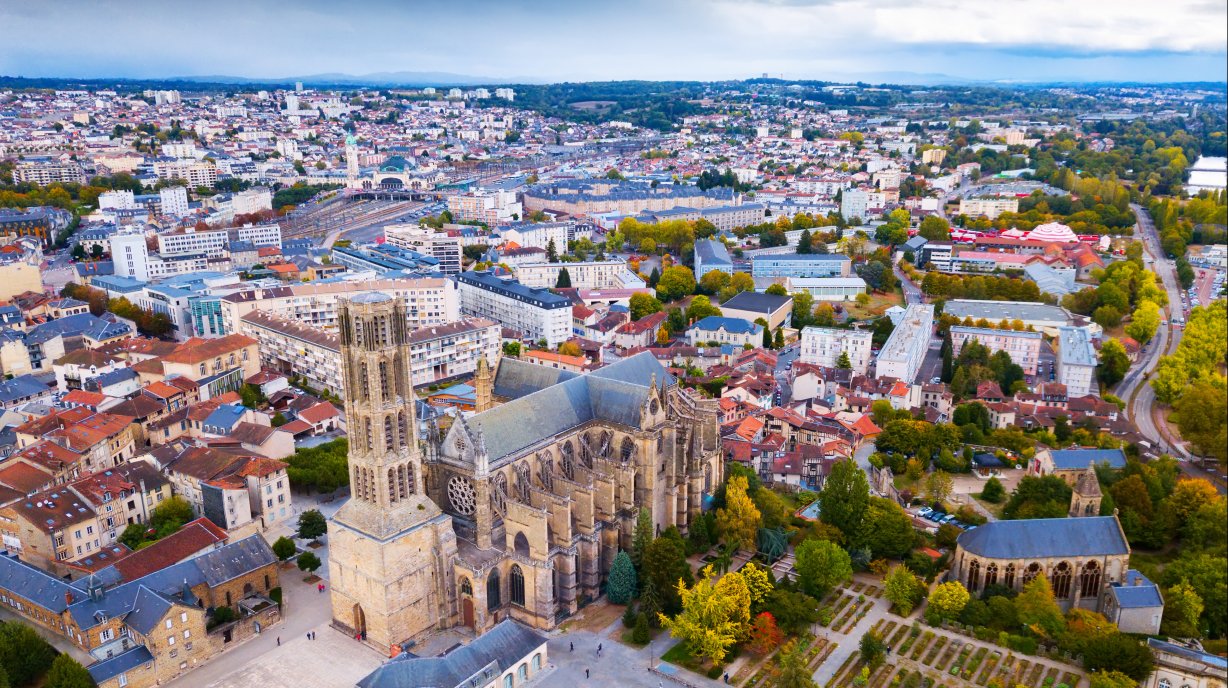
Photo by JackF on AdobeStock
According to the World Bank, cities account for only 55% of Earth’s population, and generate more than 80% of the global GDP. They also often have a high economic growth. An Oxford study estimated Paris’ growth rate between 2019 and 2035 to be approximately 1.7%. But how can we explain this urban economic growth? The economists Christian Ghiglino, Kazuo Nishimura, and Alain Venditti aim to respond to this question by using a model that combines two major economic theories.
What defines a city? A city—or urban unit, as geographers call it—is a densely populated area with a high concentration of buildings. In France, for a commune1 to be considered a city, it must have more than 2,000 residents. There are approximately 7,580 cities (for over 34,980 communes) within France, which makes up 80% of the population. And 95% of France’s population live in a sphere of urban influence.2
Why are cities so attractive? Cities are where economic activity is concentrated. Globally, they represent more than 80% of the gross domestic product (GDP)3. With nearby businesses, public transportation, numerous public services, a cultural life, and (especially) the possibility of finding a job, there are quite a few reasons why people would move to a city. A city’s economic appeal is particularly important. Through the tertiary and industrial sectors, businesses create goods and services that draw people to cities. But what are the economic mechanisms behind the growth of urban areas?
Economic growth is a major concern of local, national, and even international authorities. Pervading in political discourse and the media, this term designates an increase of production in goods and services over a given period, which is generally long-term. It is often expressed through the GDP per capita growth rate.4 When this growth rate is positive, it indicates an economically bright future. When negative, it signifies a dreaded economic regression.
In March 2022, the Bank of France readjusted its predictions, like it does every quarter, on the GDP per capita’s economic growth from an average rate of 1.7% to 2.0% per year by 20245, This number is quite close to what France’s average GDP per capita growth rate was between 1980 and 2019 of 1.8%.6 But how can this general increase of the GDP be explained?
The first theory to explain this growth in 1776 by Adam Smith has been since followed by many others. In 1956, Robert Solow and Trevor Swan presented an economic model which shows growth is fueled by external technological progress. This is also known as exogenous growth. The only problem? This technological progress is not a part of the model. So, in other words, it simply appears out of thin air. In 1986, Paul Romer responded to this model with another that demonstrates technological progress is driven by business investment decisions. In the end, these decisions are both the reason for and the result of economic growth. All the variables are therefore within the model, which is the theory of endogenous growth. In other words? Everything depends on everything.
To explain the growth of cities, the economists Christian Ghiglino, Kazuo Nishimura, and Alain Venditti propose a model that merges the theory of endogenous growth with the theory of structural change.
Photo by Netsign on AdobeStock
Why do different cities have different growth rates? The economists’ model allows us to answer this question. For this, they present three cities that rely on different sectors. The first city is a farming town which, unsurprisingly, produces an agricultural good. The second city has a secondary economy based on industry. It creates an industrial good that has an important value added: it required investment in human capital. In other words, specific training or education is necessary for production.7 The third city receives the goods from both cities and combines these to create a final product.
The economists noticed that these cities present a positive yet different growth rate over the long term. This said, the second city is characterized by a growth rate much larger than the first. Because the third city’s production capacity is dependent upon the two others, its growth is, too. As a result, the city with the lowest growth rate (the agricultural town) limits the overall growth of the third city. This heterogeneity between the cities’ growth and the performance of the industrial city can be explained by the differences of investment in human capital (which leads to greater economic growth).

Photo by Rob Lambert on Unsplash
Industrialization has increased urban economic growth, as observed with several French cities that have boomed following the arrival of a high-tech industry. This was seen in the 19th century with Limoges’ porcelain, and today it can be observed with Toulouse having recently become one of the European leaders of the aeronautics industry following the arrival of Airbus. On the other hand, cities that have continued to primarily rely on the agricultural sector, like Charolles in Saône-et-Loire (the capital of Charolais beef, whose main economic activity is farming) have not seen as great as an economic or population growth.
The economists’ article concludes by addressing this difference in the amount of economic growth. It determines that inequality between cities will not be diminished with time if policies for redistribution are not set in place. But what makes this model new is the combination of the two major economic theories on endogenous growth and structural change.
As the theory of endogenous growth has predicted, we can observe an increase in growth in developed countries over the past few decades—and, on a larger scale, over the past few centuries. This growth depends on several factors. The economists Christian Ghiglino, Kazuo Nishimura, and Alain Venditti establish links with the structural change theory, which states that as a state or city grows, the relative size of sectors of the economy change. Therefore, the agricultural sector is overtaken by the industrial sector, which is itself losing importance compared to the tertiary sector. This is what happened in France between 1896 and 1990. The economists had previously set up a similar model which, rather than looking at three different cities, examines a country’s evolution over time as it was subject to structural change.8
However, whether it is a state that changes its main sector over time or cities that specialize in different economic sectors, the result remains the same. Growth is not necessarily consistent (at least between cities), and inequalities persist over time. To reduce inequality, redistribution is necessary. And, in order to do this, specific public policies must be adopted. As the French lawyer and gastronome Anthelme Brillat-Savarin once said, “Inequality of conditions implies inequality of riches, but inequality of riches does not imply inequality of need.”
![]()
A media that makes economics accessible to all